The Company
MSLGROUP is a public relations network of companies. Specialists in strategic communications and engagement, the company is part of the French multinational Publicis Groupe. In our specific case, we worked along with their Milan agency, MSL Italy, which is now widening their scope of work, connecting data science, technology and creativity.
What they do is designing effective advertisement campaign for their clients, which are also internationals, such as Ferrero, PMI, Netflix, thus their effort is put for getting engagement from the largest possible number of users, in order to “convert” them, namely persuade them to click on one of their ads and make an action (e.g. fill a form, register, ask for further information, buy etc.)
In doing so, they asked for our help in designing a way to predict whether a not-yet released campaign can be efficient and convincing, basing the analysis on historical data, in order to have an instant feedback and see whether something can be improved in their work.
The case study: Alfa Romeo
We focused our analysis on Alfa Romeo, which is an italian car brand and which MSL designed an advertisement campaign for.
When we started the project, we worked with a dataset of about 60.000 rows, each of them describing the journey of a user on the web, coming from January 2019, made of (at most) 10 chronologically-ordered steps: at each step the user could either just visualize the ad without interacting (Impression), or click on it, or just being cookie-tracked. At the end of the described journey, the user is converted, meaning that eventually the he/she took an action after interacting with one of the ads.
For better comprehension, an intuitive visualization of the dataset is given below:
 Sankey Diagram showing users flow from casual interactions to the actual conversion.
Out of these records, we decided to extract the Click-Through Rate (CTR) of a banner, which is a ratio given by:
times the banner is clicked / times the banner is visualized
CTR is an intuitive and easy to evaluate measure from the data we have, and describes, in percentage, how likely to be clicked a banner is. Therefore, it is a metric of effectiveness of an advertisement, which we designed to be the target of our final prediction.
On top of this decision, we opted for building a tool which, when feeded with a not-yet released banner, can predict its CTR, i.e. giving a feedback on how effective it will be.
At this point, we had to ask for additional data, since the one we obtained did not include reliable estimation of the CTRs of the banners, for the following reasons:
- the dataset only covered a couple of days, which would have negatively impacted generalization over time;
- each banner appeared too few times in these records, thus the CTR extrapolated from the dataset was not the real one, but instead very biased;
- it only contained converted-users, meaning that our prediction would have been extremely optimistic (what about users who will never be converted?);
Thanks to the willingness of MSL, we were provided with an additional, huge number of logs, coming from March 2019. This kind of data was not post-processed, so it required us to get our hands dirty: it contained a very large number of lines (about 5 millions), encoded in such a way to make the logs more compact.
Each line contained one single interaction of a random user with the March 2019 campaign of Alfa Romeo, differently from the first dataset (where one single line contained 10 interactions, belonging always to the same user).
After decoding the logs, we extracted the information about each single interaction, that are:
- Banner shown
- Advertising provider (Criteo, Subito.IT, Amazon … )
- Time of the interaction
- Device where the interaction occurred (Android, Apple, Desktop)
- Click vs Non-click
From this, we could finally reconstruct the CTR of each single banner shown in March 2019. Here below, we plot the distribution of the CTRs of the March 2019 banners in comparison with the CTRs coming from January 2019.
 Histogram comparing the first and the second dataset CTRs. On the x axis there is the CTR and on the y axis the number of samples
As you can see, the two datasets show a highly different scale of the CTR, with the one coming from March 2019 being more accurate, realistic and reliable.
 Histogram the second dataset CTRs. On the x axis there is the CTR and on the y axis the number of samples
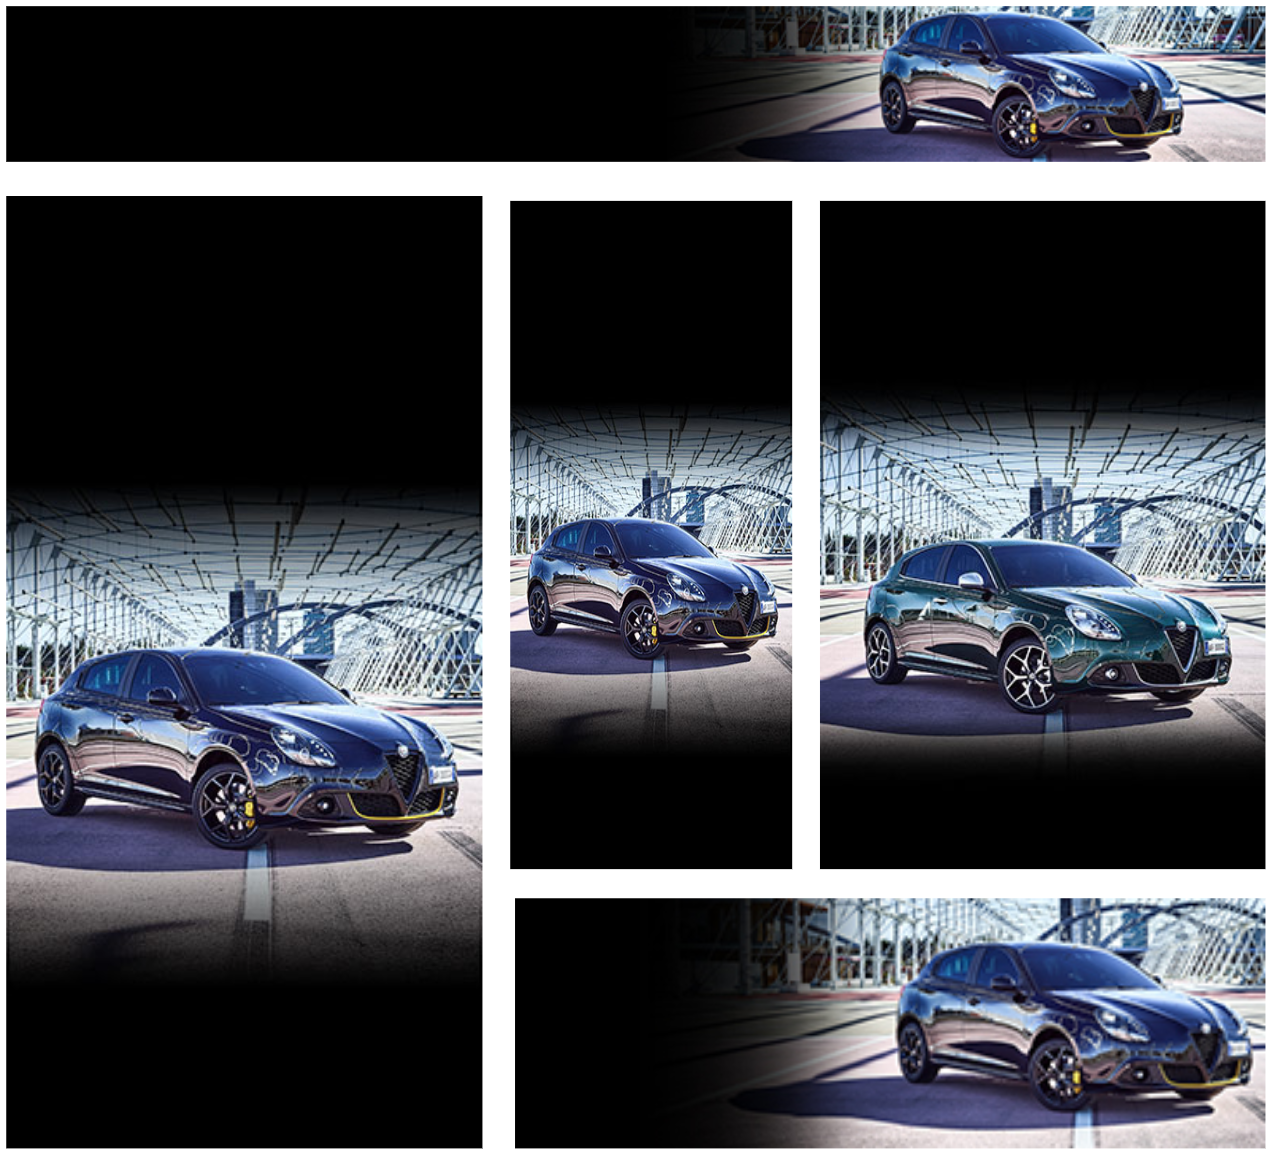
Along with these logs, we were also given the pictures of the banner shown (around 100/150). These banners were built assembling together many pictures in sequence and ending with a fallback, that is a final frame containing only text describing the advertised product.
It is worth mentioning that in this specific case study many banners only differ for the size, in the sense that they show they same pictures at different resolutions, plus all the fallbacks were pretty much identical, so our models cannot really generalize too much when trained on these samples. Further investigations can be made by training the models on a larger and more variegate banner set.
The method
As already mentioned, the CTR is defined as a ratio between the number of times a user is clicked over the number of times a user is clicked is viewed. Actually, it can be calculated at different granularities, meaning that we can pose questions like
- How many times is a banner clicked at a certain Time of the day?
- How many times is a banner clicked when published by a specific Advertiser?
- How many times is a banner clicked on a given Device?
- How many times is a banner clicked at a certain time of the day, when published by a specific advertiser, on a given device?…
Conventionally, we defined variables “Time”, “Advertiser”, “Device” as aggregators, i.e. when one (or more) of them is fixed, we can calculate the CTR on top of it (or them).
Thus, we started designing a tool which can answer questions like the ones posed above. The prediction of CTR is a supervised regression problem, solvable with a Machine Learning model. But what will the model be feeded with? Of course it will learn the behaviour of the banners in different time spans, on different devices and with different advertisers, but how do we represent the banners?
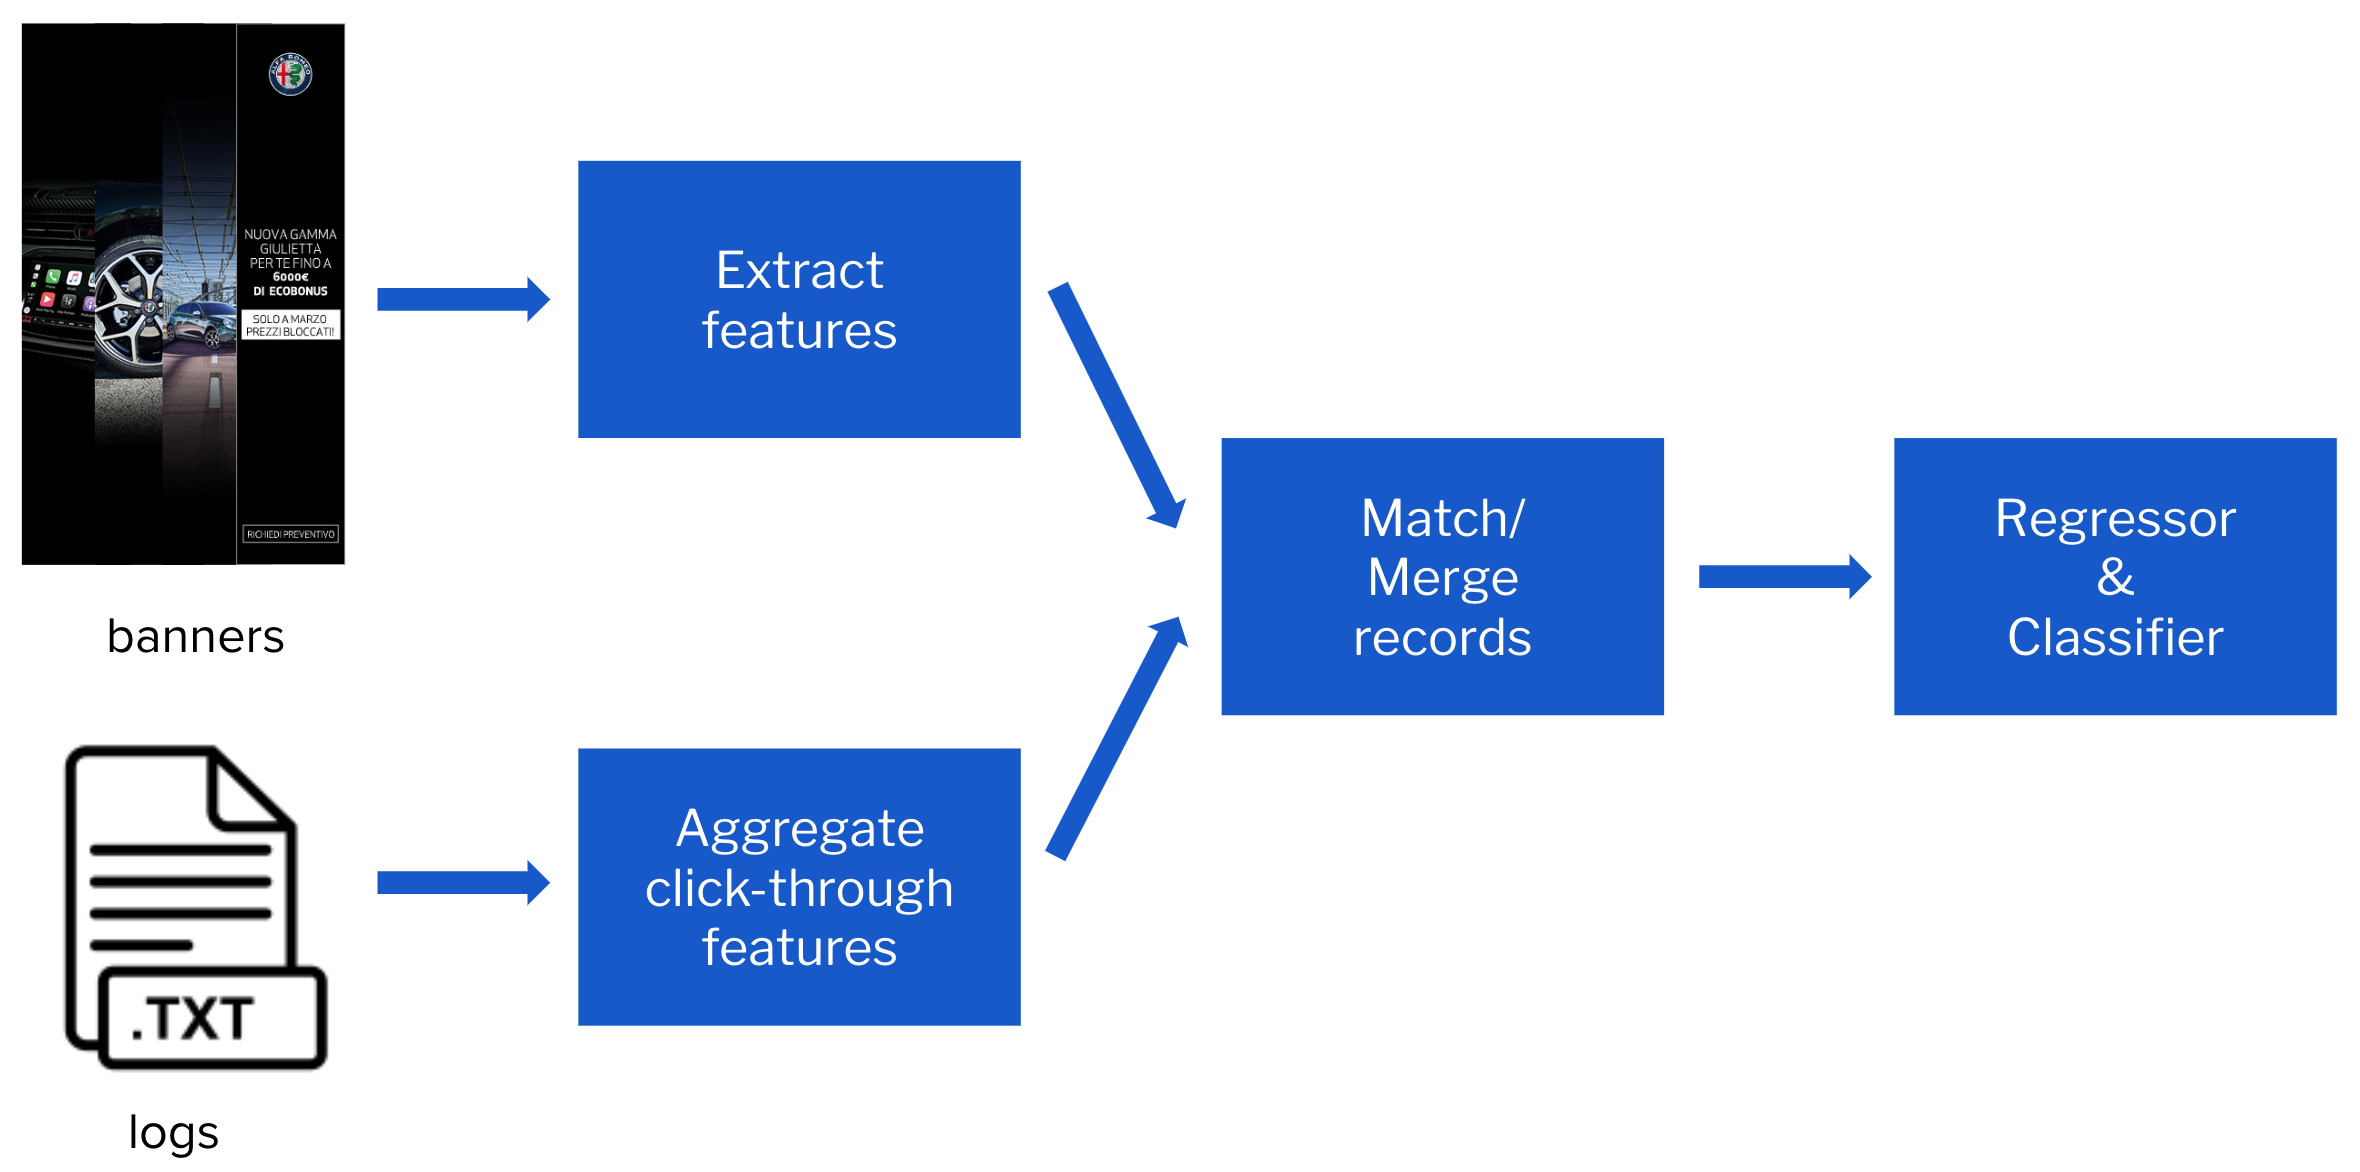
In doing so, we chose to extract features from the banners that we had, with two possible options, which will be detailed below: Visual Features extraction and Autoencoder representation.
Visual Features
According to Azimi, 2012, the visual appearance of an advertisement impacts its performance. This conclusion is obtained after a number of experiments to evaluate the effectiveness of visual features in CTR prediction. Here below, we make a couple of examples of what “visual features” (VF) of a banner are:
Gray level contrast and gray level histogram bins.

Number of dominant colors in a banner.

Therefore, our approach was to extract these VF from each frame of the banners and aggregating them by mean, in order to build a numerical representation of the banners. Then, we tried to predict the CTR with different aggregations (Time, Advertiser, Device and combinations of these) on top of this information and adding the model of the advertised car as a meta-data.
Of course, aggregators itself impact the performance of the models, and it turned out that taking advantage of the couple (Time, Advertisement) has positively effect on R2 , whereas when one of them is dropped, the regression results were poor.
In these cases, we turned the problem into a classification one, distinguishing between banner performing in the top 30%/bottom 70%.

The results obtained with cross-validation are the following:
- Regression on Visual Features + Advertiser: R2 = 0.640 Gradient Boosting
- Regression on Visual Features + Advertiser + Time: R2 = 0.760 Gradient Boosting
- Regression on Visual Features + Advertiser + Time + Device: R2 = 0.654 Bayesian Ridge
- Classification on Visual Features + Device: F1 score = 0.780 Logistic Regression
- Classification on Visual Features + Time: F1 score = 0.745 Logistic Regression
- Classification on Visual Features + Time + Device: F1 score = 0.741 Logistic Regression
- Classification on Visual Features + Advertiser + Device: F1 score = 0.841 Logistic Regression
In the model based on the aggregation of Time, Advertiser, Device, for each banner we have 5 (time intervals we chose, instead of 24) x 11 (advertisers) x 3 (device) = 165 different combinations, and for each of them we have to calculate a different CTR and train on these. Unfortunately, not for all the combinations we had enough samples, thus the estimation of the value is not reliable. The performance drops consequently.
One thing we discovered later is that although we can reach a high R^2 score with our models. The main source of their predictive power don’t actually come from the visual features we extracted. In other words, if we remove the visual features from our model input, we can still get a similar prediction accuracy.
For example, here are the results of the regressions when we estimate CTR on a single aggregator.

What is noticeable is that adding visual features as predictors has negligible effect on prediction accuracy. This is because, as already mentioned, the banners in our dataset are composed by the same set of images, in the sense that they are visually the same. In this case, what visual features truly represent is the size of our banners, which is already one of our features. This explains the negligible effect of visual features on prediction accuracy.

Autoencoder
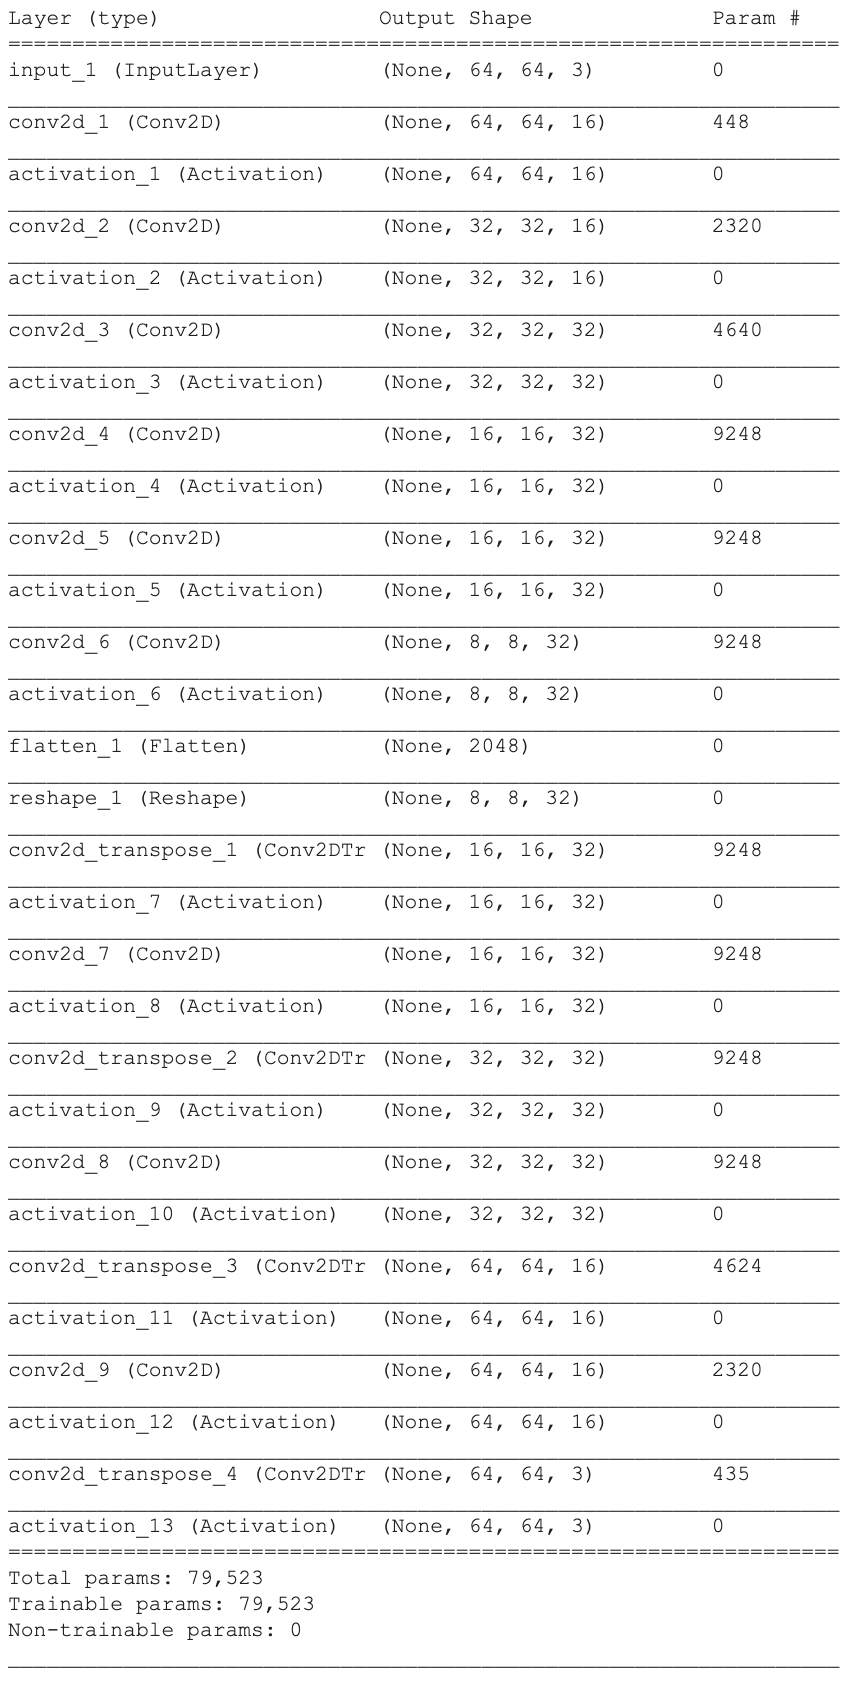
AE architecture

We trained this autoencoder on a car advertisement dataset. This dataset is a subset of all banners published by Zaeem, which haas 64,832 advertisement images in total. After being trained on this dataset, we made MSL advertisement the test set. Our reconstruction quality in the test set is good.
Reconstruction

Although reconstruction is fine, the predictive power of the latent variables are not so good. Through trials and errors, we found that 2048 is the least number regarding the length of dimension that makes capable to reconstruct our image. We applied a Lasso regularization regression and uses cross validation to find the optimal regularization term. It turns out that the latent features did not yield better prediction than without these features.
In conclusion, we have a good baseline for predicting CTR with non-visual features, but unfortunately we cannot make much improvement on this baseline using visual features (or features extracted with autoencoder) given our current dataset. We believe more diverse banner designs are needed in the future to accomplish this task.
Deliverable
The poor performance of model should be expected with limited Data:
- Visually different images are needed to learn the effect of their visual aspect
- Large number of impressions are needed to estimate click-through rate conditioned on certain scenario (given publisher, hour of the day...)
- Study of the effect of visual aspect typically carried out by advertisement publishers who have access to large number of banners (thousands) each with a large number of impressions (hundreds of thousands).
Results would be more easily analyzable (and probably promising) in the presence of a larger amount of data, that is why we came out with a predictive tool that estimate the click-through rate, which can be updated in the future with logs coming from other campaigns and other banner-sets, and the model lying behind can also be retrained on top of the new data.
It has two part. The frontend will be a user interface written in HTML (using p5.js) and the backend is written in Python (using Flask).
Frontend
The frontend, as May the 9th, is still in the concept phase.
Video prototype of the web-app showing the interactions the user would be enabled to do.The final outcome would be a web-app packaged as an HTML file connected to the python backend through P5.js library.
Backend
The backend is packaged as a python module called Breanna. Part of the backend is for serving trained models for the frontend. Since our models are trained on limited data, we anticipate the model to change in the future. Another part of the backend will assist data scientists to manage campaign data and train new models. Breanna has 4 submodules: feature_extraction (which help with extracting visual features from images), database_access (which help with processing campaign web logs and store/query them), ctr_model_management (which help with training models to predict click-through rate) and alfaromeo_specific (which contains some helper functions specific to the Alfa Romeo campaign).
Use case for strategists
Strategists will interact with the tool through the frontend. They will start with uploading an banner design as an image. After that, they can specify how to aggregate the click-through rate.
The tool supports aggregate click-through rate over the publisher, the hour of the day and users’ device (and combinations of any of these three). Finally they will get a dashboard visualizing the click-through rate prediction which will help them compare the banner designs.
Use case for data scientists
Data scientists will interact with the tool through Breanna. There are 3 use cases:
- Load new campaign data into the database: Before loading, the database needs to be first initialized (once). After that, whenever there is new campaign data (in the form of folders of images for banner designs and web logs for user-banner interaction data), data scientists can use Breanna to process and store these data into the database.
- Train and evaluate new models: Data scientists can conveniently create training set by specifying the following parameters: what campaign data to use, what click-through rate aggregators to use, what visual features to use, how to match banner names with ad names. We provide a function to cross validate different scikit-learn models on the training set.
- Create and serve new models: Data scientists can create new models to serve the frontend. This can be done by creating and saving a CTRModel class in Breanna. The mapping from frontend request to the model can be configured inside the code.
For detailed operations, please see Documentation for Breanna.
Conclusions and future work

Of course, what has been done so far can be thought just as a little seed in a field of all the possible researches that can be carried on in these area.
Firstly, as already mentioned, in our case the banner set was limited, thus the model deployed do not generalize well in general, but it would be worth exploring how these same models would perform in other contexts, with many more variegate banners.
Also, there are still other visual features that can be extracted from the banners: these can be easily added in the backend by the data-scientist user of our tool, and see whether they impact better or worse the prediction.
Instead, it would be interesting focus the analysis on other kind of features, like objects in the images or text: this was not worth investigating in our case, since the text was pretty much identical in all the banners, and all of them were always containing the same objects (cars, wheels…), but thinking of a wider range of banners, coming from different brands, it would be intriguing expand in this direction.
Furthermore, Click-Through Rate is just one of the possible metrics of effectiveness of a banner, it is possible to investigate more: what is the conversion-rate of a banner? How long does the user pose his/her cursor on the banner? How long does the user remains the landing page after clicking on it? … and what about the social media engagement after the release of a new campaign?
We are satisfied of what has been done, but also confident that much more can be examined, and we hope we gave the intuition that proceeding in this direction can be fascinating and profiting.
Partners


Created by
Feiyu Chen
Alessandra Facchin
Alessandro Paticchio
Zizheng Xu